Identify The Range Of The Function Shown In The Graph.
Arias News
Mar 21, 2025 · 6 min read
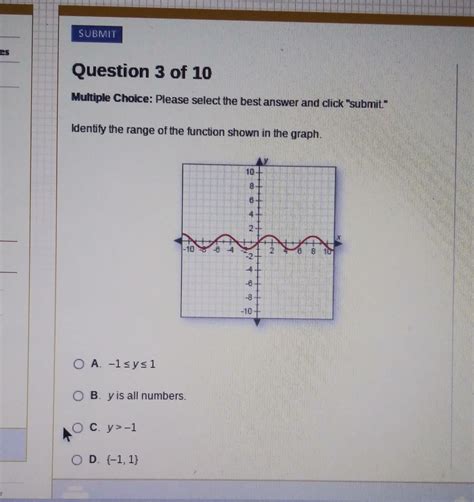
Table of Contents
Identifying the Range of a Function Shown in a Graph
Determining the range of a function from its graph is a fundamental concept in mathematics, crucial for understanding the function's behavior and its limitations. The range, simply put, represents all the possible output values (y-values) a function can produce. This article will explore various methods and techniques for identifying the range of a function presented graphically, covering different types of functions and handling complexities like discontinuities and asymptotes.
Understanding the Concept of Range
Before diving into techniques, let's solidify the definition of the range. The range of a function is the complete set of all possible output values or dependent variable values (usually denoted as 'y') that the function can produce. It's the interval or set of intervals on the y-axis that the graph occupies. Contrast this with the domain, which represents the set of all possible input values (usually 'x'). Together, the domain and range completely describe the function's behavior across its defined space.
Visual Inspection: The Easiest Method
The most straightforward approach to finding the range is through visual inspection of the graph. This method is particularly effective for simple functions with continuous, easily identifiable curves. Let's illustrate:
Example 1: A Simple Linear Function
Imagine a graph of a linear function like y = 2x + 1. This line extends infinitely in both directions. Therefore, the range is all real numbers, often represented as (-∞, ∞) or ℝ.
Example 2: A Parabola (Quadratic Function)
Consider a parabola like y = x² . This parabola opens upwards, with its vertex at the origin (0,0). The y-values start at 0 and extend infinitely upwards. Thus, the range is [0, ∞). The square bracket indicates that 0 is included in the range.
Example 3: A Piecewise Function
Piecewise functions are defined by multiple expressions across different intervals of the domain. Visual inspection becomes crucial here. Let's consider a function with two parts: y = x for x ≤ 0 and y = x² for x > 0. By observing the graph, we can determine that the range includes all non-positive values (y ≤ 0) from the first part and all non-negative values from the second part (y ≥0), meaning the range is (-∞, ∞) or ℝ.
Handling Discontinuities
Functions with discontinuities—gaps or breaks in their graphs—require a more careful analysis. These discontinuities can significantly impact the range.
Example 4: A Function with a Hole
Suppose a function has a "hole" at a specific point. This means the function is undefined at that particular x-value. However, this doesn't necessarily affect the range unless the "hole" represents a missing y-value that would otherwise be included. For example, a function with a hole at (2,5) but otherwise continuous will still have a range that includes 5 if other points have a y-value of 5.
Example 5: A Function with a Jump Discontinuity
A jump discontinuity is when the function "jumps" from one value to another at a certain point. The range will exclude the interval between the two disconnected parts of the function.
Example 6: A Function with an Asymptote
Asymptotes are lines that the graph approaches but never touches. Horizontal asymptotes particularly impact the range. If a function has a horizontal asymptote at y = c, then 'c' may or may not be included in the range depending on whether the function actually reaches that value at some point. The range would likely be an interval that approaches 'c' but might not include it, or it could exclude values above or below that asymptote.
Advanced Techniques: Using Function Properties
For more complex functions, visual inspection alone might be insufficient. We can leverage the function's properties to precisely determine the range.
1. Finding the Maximum and Minimum Values
Many functions have maximum or minimum values. These values represent the upper and lower bounds of the range. For instance, quadratic functions, trigonometric functions, and many other types exhibit maximum or minimum values that can be identified either graphically or through calculus (finding critical points).
2. Using Calculus (Finding Critical Points)
Calculus provides powerful tools for determining the range. By finding the derivative of the function and setting it to zero, we can locate critical points (where the slope is zero). These critical points may correspond to local maxima or minima. By analyzing the function's behavior around these points and considering the function's end behavior (what happens as x approaches infinity and negative infinity), we can precisely define the range. This method is best applied to differentiable functions.
3. Considering the Function's Domain
The domain of a function can provide insights into its range. For example, if a function's domain is restricted, its range will be affected accordingly. If a function is only defined for positive x-values, then the range will only contain y-values generated by these x-values.
4. Using Transformations
Knowing the basic graph of a function and understanding transformations (shifts, stretches, reflections) can help predict the range of a modified version of the function. For example, if you know the range of y = x², you can easily determine the range of y = x² + 3 (shifted up by 3 units) or y = -x² (reflected across the x-axis).
Illustrative Examples with Detailed Explanations
Let’s work through a few more complex examples, demonstrating the application of these techniques:
Example 7: A Rational Function
Consider the rational function: y = 1/(x-2)
- Domain: The function is undefined when the denominator is zero, i.e., when x = 2. Therefore, the domain is (-∞, 2) U (2, ∞).
- Asymptotes: There is a vertical asymptote at x = 2 and a horizontal asymptote at y = 0.
- Range: The function approaches 0 as x goes to positive or negative infinity, but it never actually reaches 0. Also, it never takes on the value of 0. The function approaches positive infinity as x approaches 2 from the right and negative infinity as x approaches 2 from the left. Therefore, the range is (-∞, 0) U (0, ∞).
Example 8: A Trigonometric Function
Consider the function y = 2sin(x) + 1
- Periodicity: The sine function is periodic, meaning it repeats its values. The range of sin(x) is [-1, 1].
- Transformation: The function y = 2sin(x) + 1 is a vertical stretch by a factor of 2 and a vertical shift upwards by 1 unit.
- Range: The range of 2sin(x) is [-2, 2]. Shifting this up by 1 unit gives us a range of [-1, 3].
Example 9: A Function with a Square Root
Let's examine the function y = √(x-1) +2
- Domain: The expression inside the square root must be non-negative, so x - 1 ≥ 0, which means x ≥ 1. The domain is [1, ∞).
- Range: The square root of a non-negative number is always non-negative. The minimum value occurs when x = 1, resulting in y = √(1-1) + 2 = 2. As x increases, y also increases without bound. Therefore, the range is [2, ∞).
Conclusion: Mastering Range Identification
Identifying the range of a function from its graph requires a combination of visual inspection and a thorough understanding of function properties. By mastering these techniques, you can accurately determine the range for a wide variety of functions, from simple linear equations to complex trigonometric and rational functions. Remember to consider discontinuities, asymptotes, maxima, minima, and the impact of domain restrictions. With practice and careful analysis, you'll become proficient in identifying the range of any function presented graphically. The ability to accurately identify a function’s range is not only crucial for mathematical understanding but also forms the foundation for more advanced topics like calculus and analysis.
Latest Posts
Latest Posts
-
What Is An Equivalent Fraction To 3 5
Mar 22, 2025
-
How Many Shots Are In A Half A Pint
Mar 22, 2025
-
What Does Cate Often Call Her Twin Sister
Mar 22, 2025
-
How To Find The Store Manager Name
Mar 22, 2025
-
How Many Ounces Are In One Ton
Mar 22, 2025
Related Post
Thank you for visiting our website which covers about Identify The Range Of The Function Shown In The Graph. . We hope the information provided has been useful to you. Feel free to contact us if you have any questions or need further assistance. See you next time and don't miss to bookmark.
